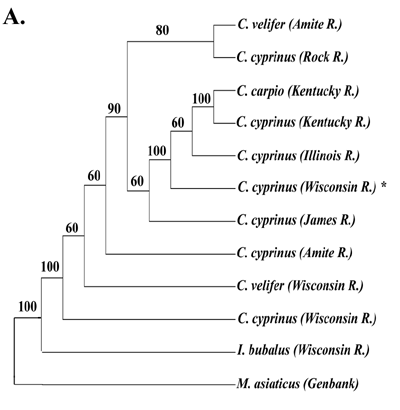

Figure A: 50% majority-rule consensus of ten equally parsimonious trees obtained from phylogenetic analysis of partial cytochrome b sequence data weighted (3:1) for observed transition/transversion bias. Numbers above the nodes are bootstrap values.
Return to mtDNA Sequencing

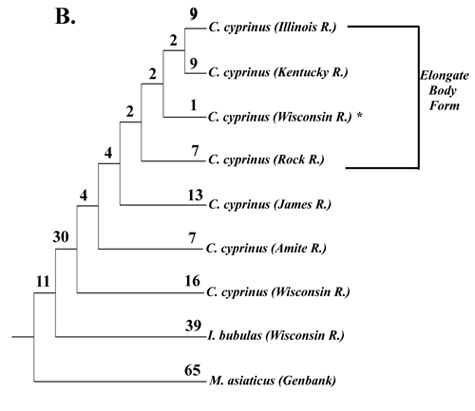
Figure B: Tree obtained from unweighted parsimony analysis of partial cytochrome b sequence data for only the C. cyprinus-like forms plus Ictiobus bubalus. Numbers above the branches are branch lengths.
Return to mtDNA Sequencing